Bad Estimates

May 3, 2021 at 10:55 am

People are bad at esti­mat­ing. We over­sim­pli­fy to get faster answers. We aver­age out com­plex­i­ties because they can’t fit neat­ly into our model. Unresolved prob­lems are uncom­fort­able. It’s incon­ve­nient to wait for data so we quick­ly move things along. We cre­ate starter solu­tions. We label things work in progress. We pro­pose tem­po­rary solu­tions and acknowl­edge that things will change over time as we col­lect more infor­ma­tion. We say we’ll get bet­ter as we go along.

Then, iner­tia takes over. The first takes become the stan­dard. The imper­fect model morphs into guide­lines and “the way it’s always been done.” Systems are built around the orig­i­nal find­ings. When the rest of the data comes in, when base assump­tions are proven as flaws, when extra exter­nal fac­tors are includ­ed — it’s no longer seen as a progress of knowl­edge, but as a chal­lenge to convention.

Here are two such chal­lenges I found this week­end. Carbon off­set cred­its for pre­serv­ing for­est land are com­ing up short on the amount of car­bon diox­ide they actu­al­ly sequester. The real estate mar­ket in the United States is not prop­er­ly account­ing for flood zones.

That’s because the state was using aver­ages to esti­mate how much CO2 each par­cel of for­est could hold. In real­i­ty, some pieces of for­est can store more than oth­ers based on what kinds of trees are there and how dense the for­est is. Forest man­agers also “gamed the sys­tem” by sell­ing cred­its from parcels that inflat­ed how much car­bon they stored, ProPublica and MIT Technology Review reported.

By Justine Calma at The Verge

Our find­ings indi­cate that hous­es in flood zones in the United States are cur­rent­ly over­val­ued by a total of $43.8 bil­lion (95% con­fi­dence inter­val: $32.6 to $55.6 bil­lion) based on the infor­ma­tion in pub­licly avail­able flood haz­ard maps alone, rais­ing con­cerns about the sta­bil­i­ty of real estate mar­kets as cli­mate risks become more salient and severe.

The effect of infor­ma­tion about cli­mate risk on prop­er­ty values

Epicurious: After Beef

April 28, 2021 at 2:55 pm

Starting back in the fall of 2019, the recipe and cook­ing resource site Epicurious qui­et­ly start­ed cut­ting beef from its culi­nary cov­er­age. They pub­lished a select few beef pieces since then, but start­ing this week, no more.

Today Epicurious announces that we’ve done just that: We’ve cut out beef. Beef won’t appear in new Epicurious recipes, arti­cles, or newslet­ters. It will not show up on our home­page. It will be absent from our Instagram feed.

We know that some peo­ple might assume that this deci­sion sig­nals some sort of vendet­ta against cows—or the peo­ple who eat them. But this deci­sion was not made because we hate ham­burg­ers (we don’t!). Instead, our shift is sole­ly about sus­tain­abil­i­ty, about not giv­ing air­time to one of the world’s worst cli­mate offend­ers. We think of this deci­sion as not anti-beef but rather pro-planet.

The Planet on the Plate: Why Epicurious Left Beef Behind

If you haven’t taken inven­to­ry of your food deci­sions, please read this piece about their deci­sion mak­ing and the ques­tions they had to con­front. If you have already made changes to your diet, use these links to help spread infor­ma­tion to those around you. The writ­ing and facts are straight­for­ward. It’s also self-aware enough to admit that this is just one lit­tle act that needs big­ger and big­ger support.

Meat — be it beef, chick­en, or seafood — makes up about 5% of my fam­i­ly’s year­ly diet. We start­ed cut­ting it out over two years ago when it had been an every day fea­ture. On about fif­teen spe­cial days a year, we indulge and have a meat meal. Even then, we still choose more sus­tain­able options. Most often that’s local seafood since we’re on the Gulf Coast. We’re also not com­plete­ly vegan; we eat dairy and eggs and cheese. A sus­tain­able diet is a spec­trum and there are some easy wins to help the plan­et by cut­ting out the worst polluters.

Sure, there’s lots of bean and rice meals. But that’s okay. That’s what we should be eat­ing. That’s what a lot of peo­ple all over the world eat. Pitch in, do your part, and join the side of human­i­ty that wants Earth to stay functional.

(Photo Credit: Lou Liebau)

New Normals (Climate Edition)

April 22, 2021 at 11:20 am

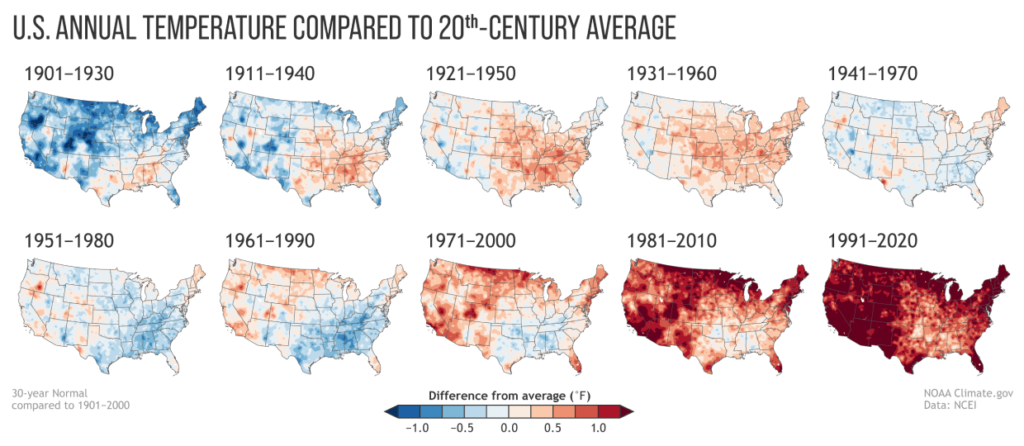
When the mete­o­rol­o­gist giv­ing you a weath­er fore­cast says, “This week’s tem­per­a­tures are going to be a lit­tle warmer than usual,” they are ref­er­enc­ing pub­lished obser­va­tions from the National Oceanic and Atmospheric Administration (NOAA) U.S. Climate Normals. Every decade a new report is released that rolls the data for­ward slid­ing on a 30-year win­dow. So right now, the mete­o­rol­o­gist is com­par­ing today to the aver­age of 1981 to 2010. After the upcom­ing NOAA update in May, the com­par­i­son will be to the aver­age of 1991 to 2020. Your daily weath­er report is a shift­ing base­line of cli­mate change.

Alongside the ques­tions about when the new Normals will be released (first week of May), we’ve got­ten a lot of ques­tions about the Normals and glob­al warm­ing. Is glob­al warm­ing affect­ing the Normals? (Yes). Are the Normals adjust­ed to “sub­tract out” glob­al warm­ing? (No.) So the new nor­mal reflects our chang­ing cli­mate? (Yes). Then how do we keep track of what used to be nor­mal? (Different analyses.)

So what hap­pens when you step back from the short sight­ed Normals and start doing that “dif­fer­ent analy­ses?” (I know, I know — thir­ty years is short sight­ed? Yes. In the grand scheme of plan­e­tary sci­ence and mil­lions of years, it’s a blip. We must think big­ger.) You don’t have to look far because you can com­pare each update of the Normals start­ing from the first peri­od of 1901–1930. Now with a cen­tu­ry in the books, things look pret­ty bad.

Map of U.S Annual Temperature Compared to 20th-Century Average, Most areas are 1℉ warmer, large areas have already increased 2℉ in the last century, NOAA climate data, climate change

Annual aver­age tem­per­a­tures have risen 2°F in much of the U.S.

Everywhere in the U.S. is warmer now than dur­ing the 20th century.

Precipitation is get­ting pushed to the extremes. Areas are 12.5% wet­ter or drier.

Planting zones are shift­ing north­ward and up elevations.

The plant­i­ng zone maps empha­sized a key point about the Normals and cli­mate change: the once-per-decade update means these prod­ucts grad­u­al­ly come to reflect the “new nor­mal” of cli­mate change caused by glob­al warm­ing. What’s nor­mal today is often very dif­fer­ent than what was nor­mal 50 or 100 years ago.

Happy Earth Day!

(via kot­tke)

Oat Milk, the SEC, and Climate Change

April 20, 2021 at 10:43 am

Oatly, the Swedish oat milk com­pa­ny, just filed paper­work yes­ter­day (2021−04−19) to go pub­lic. They’re a pret­ty pro­gres­sive and sus­tain­ably mind­ed com­pa­ny so they are upfront about cli­mate change as one of the risk fac­tors for their busi­ness. It’s a nice mix of shock­ing and appre­cia­tive to see the words laid out in a reg­u­la­to­ry fil­ing after the lawyers and finance wonks have fine­ly craft­ed the verbiage.

Additionally, the oats from which our prod­ucts are sourced are vul­ner­a­ble to adverse weath­er con­di­tions and nat­ur­al dis­as­ters, such as floods, droughts, frosts, earth­quakes, hur­ri­canes, pesti­lence and other short­ages and dis­ease, which can adverse­ly impact quan­ti­ty and qual­i­ty, lead­ing to reduced oat yields and qual­i­ty, which in turn could reduce the avail­able sup­ply of, or increase the price of, our raw mate­ri­als. The mono­cul­tures that we use are also sen­si­tive to dis­eases, pests, insects and other exter­nal forces, which could pose either short term effects, such as result in a bad har­vest one year, or long term effects, which could require new oat vari­eties to be grown. […]

There is also the con­cern that car­bon diox­ide and other green­house gases in the atmos­phere may have an adverse impact on glob­al tem­per­a­tures, weath­er pat­terns and the fre­quen­cy and sever­i­ty of extreme weath­er and nat­ur­al dis­as­ters. If such cli­mate change has a neg­a­tive effect on agri­cul­tur­al pro­duc­tiv­i­ty, we may be sub­ject to decreased avail­abil­i­ty or less favor­able pric­ing for oats and other raw mate­ri­als that are nec­es­sary for our prod­ucts. Due to cli­mate change, we may also be sub­ject­ed to decreased avail­abil­i­ty of water, dete­ri­o­rat­ed qual­i­ty of water or less favor­able pric­ing for water, which could adverse­ly impact our man­u­fac­tur­ing and dis­tri­b­u­tion operations.

Oatly F‑1 Statement

In fact, the Securities and Exchange Commission is wel­com­ing pub­lic input on whether cli­mate change dis­clo­sures are infor­ma­tive enough and how reg­u­la­tions might force com­pa­nies to address envi­ron­men­tal impacts in their offi­cial com­mu­ni­ca­tions. Apparently, investor demand about cli­mate change has “grown dra­mat­i­cal­ly” since the SEC last looked at in 2010. Gee, I won­der why?

Also, shout-out for the F‑1 name drop­ping indus­tri­al agri­cul­ture’s reliance on mono­cul­tures as pos­ing both short and long term risks to food production.

A pile of Oatly products, oat milk, oat yogurt, oat coffee latte

(via the verge)

3.6 Million Years

April 12, 2021 at 3:00 pm

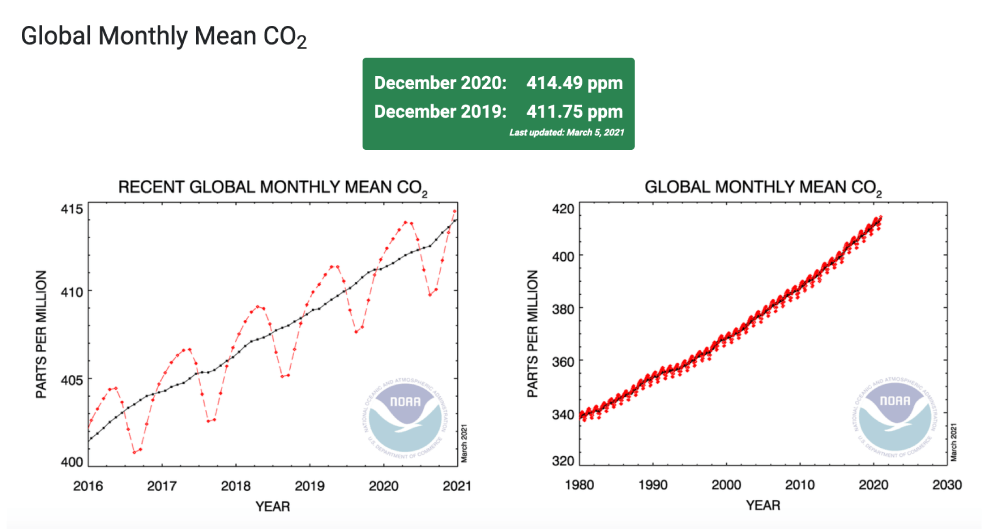
While falling down the Thwaites Glacier hole this morn­ing, there was more cli­mate change news released last week. The num­bers are star­tling, dead­en­ing, and make me stum­ble to find words. We made mil­lion year changes in just one hun­dred. We’ve reshaped the world and don’t even know — or can imag­ine — how yet.

The atmos­pher­ic bur­den of CO2 is now com­pa­ra­ble to where it was dur­ing the Mid-Pliocene Warm Period around 3.6 mil­lion years ago, when con­cen­tra­tions of car­bon diox­ide ranged from about 380 to 450 parts per mil­lion. During that time sea level was about 78 feet high­er than today, the aver­age tem­per­a­ture was 7 degrees Fahrenheit high­er than in pre-industrial times, and stud­ies indi­cate large forests occu­pied areas of the Arctic that are now tundra. 

National Oceanic and Atmospheric Administration Research
Global monthly mean carbon dioxide, December 2020 414.49ppm, two charts showing increases in CO2, chart one is from 2016-2020, chart two is from 1980-2020

Magazine Time Travel

April 12, 2021 at 12:15 pm

I stum­bled into an inter­est­ing — and unset­tling — time trav­el expe­ri­ence this morn­ing. In today’s online, con­stant­ly updat­ing world, when you search for some­thing you get the lat­est updates. Algorithms don’t show you two year old arti­cles when the terms can be found in more recent­ly pub­lished material.

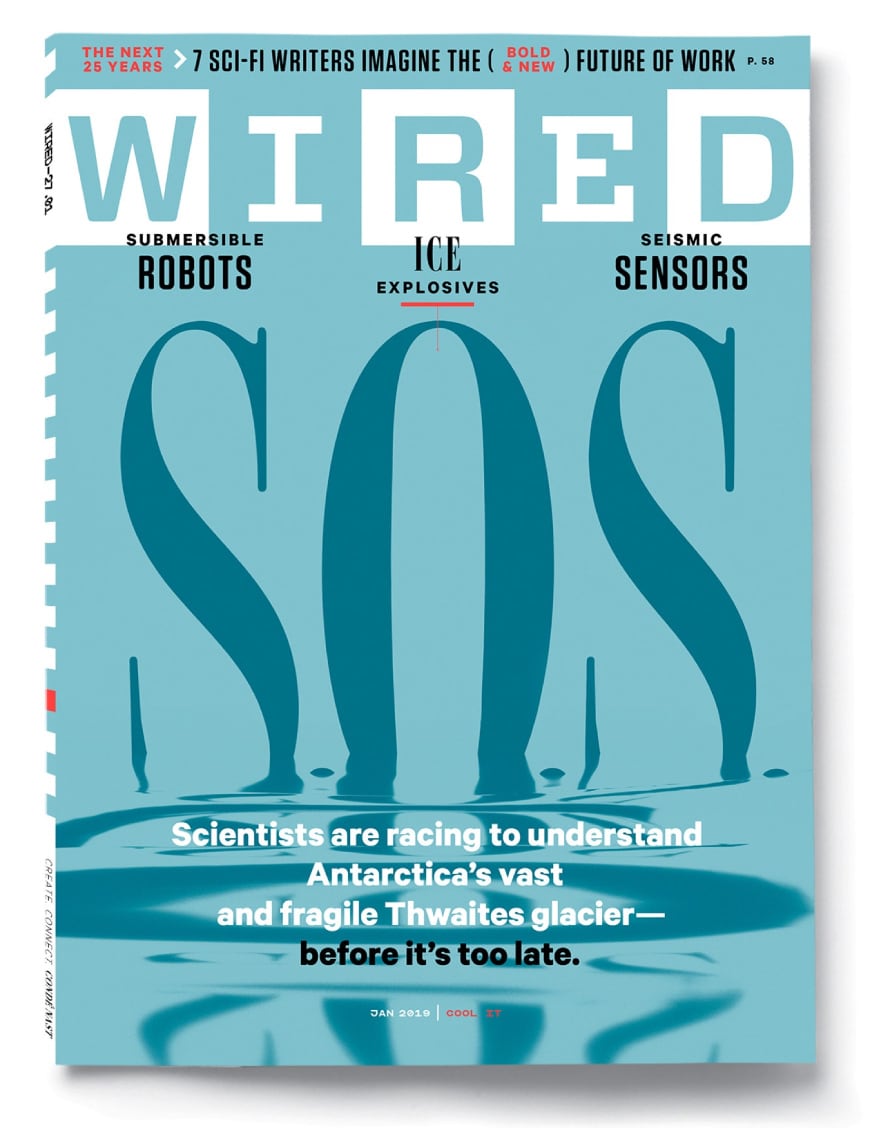
I sat down on Saturday to clean out a stack of Wired mag­a­zines I had been pil­ing up in a when-I-have-time tower. Thanks to pre­vi­ous pro­cras­ti­na­tion and pan­dem­ic time dila­tion, the issues stretched back to January of 2019. As always, the jour­nal­ism was out­stand­ing. Superb sub­jects, won­der­ful writ­ing, delight­ful design. The arti­cle that snagged my atten­tion and pro­duced this morn­ing’s para­dox was The Race to Understand Antarctica’s Most Terrifying Glacier.

Wired Magazine, Cover January 2019. SOS about the Thwaites Glacier, global sea level rise, climate change

Of course it was cli­mate change. Also of note, I had already stopped my print sub­scrip­tion sev­er­al months ago since that’s just more con­sump­tion of paper and trans­porta­tion costs and anoth­er tiny bur­den on resources I can elim­i­nate from my daily life.

It struck me enough to search for Thwaites Glacier this morn­ing and what should I find? A brand new arti­cle pub­lished three days ago. I jumped from we need more data to we have more data in one day. Boom, time trav­el! Unfortunately, it was­n’t good news.

For the first time, researchers have col­lect­ed data from under­neath the remote Thwaites Glacier in West Antarctica using an under­wa­ter robot. Findings reveal that the sup­ply of warm water to the glac­i­er is larg­er than pre­vi­ous­ly thought, trig­ger­ing con­cerns of faster melt­ing and accel­er­at­ing ice flow.

It’s been a few years since I’ve watched Waterworld. Maybe it’s time for a refresh­er. Ooh, anoth­er idea. Disney needs to cre­ate a series of Primitive Technology videos with Moana char­ac­ters teach­ing kids the skills they will need to sur­vive in the envi­ron­ment they will inher­it. I don’t think a mag­i­cal water spir­it is going to be there to save them.

(Vessel Photo by Aleksandra Mazur)

A Mile of Greenland Ice

March 17, 2021 at 3:15 pm

Here’s anoth­er canary in the coal mine arti­cle for human pow­ered cli­mate change. The story has every­thing from Cold War nuclear mis­siles to left­overs for­got­ten in freez­ers and cool nick­names like Project Iceworm. It turns out that just hop­ing nat­ur­al sys­tems are infi­nite and resilient isn’t a reli­able civ­i­liza­tion plan.

The dis­cov­ery helps con­firm a new and trou­bling under­stand­ing that the Greenland ice has melt­ed off entire­ly dur­ing recent warm peri­ods in Earth’s his­to­ry — peri­ods like the one we are now cre­at­ing with human-caused cli­mate change.

Understanding the Greenland Ice Sheet in the past is crit­i­cal for pre­dict­ing how it will respond to cli­mate warm­ing in the future and how quick­ly it will melt. Since some twen­ty feet of sea-level rise is tied up in Greenland’s ice, every coastal city in the world is at risk.

Science Daily

You know what’s even sad­der to think about it? If some­one had been pay­ing atten­tion to those ice cores over 50 years ago, it still would not have mat­tered. They could have released a sci­en­tif­ic study about these fos­silized leaves at the first Earth Day in 1970 and we would still be in the same boil­ing pot we are now. People think in decades and life­times not mil­len­nia. The trend seems to be speed­ing up instead of slow­ing down. When we careen off the cliff, here’s to hop­ing for wide open water to splash down in.

Photo Credit: William Bossen